
Product documentation
Standard Microsoft Dynamics 365 for Finance and Operations comes with an embedded Power BI “Warehouse performance”. This displays limited data about shipping performance, inbound performance and location inventory accuracy.
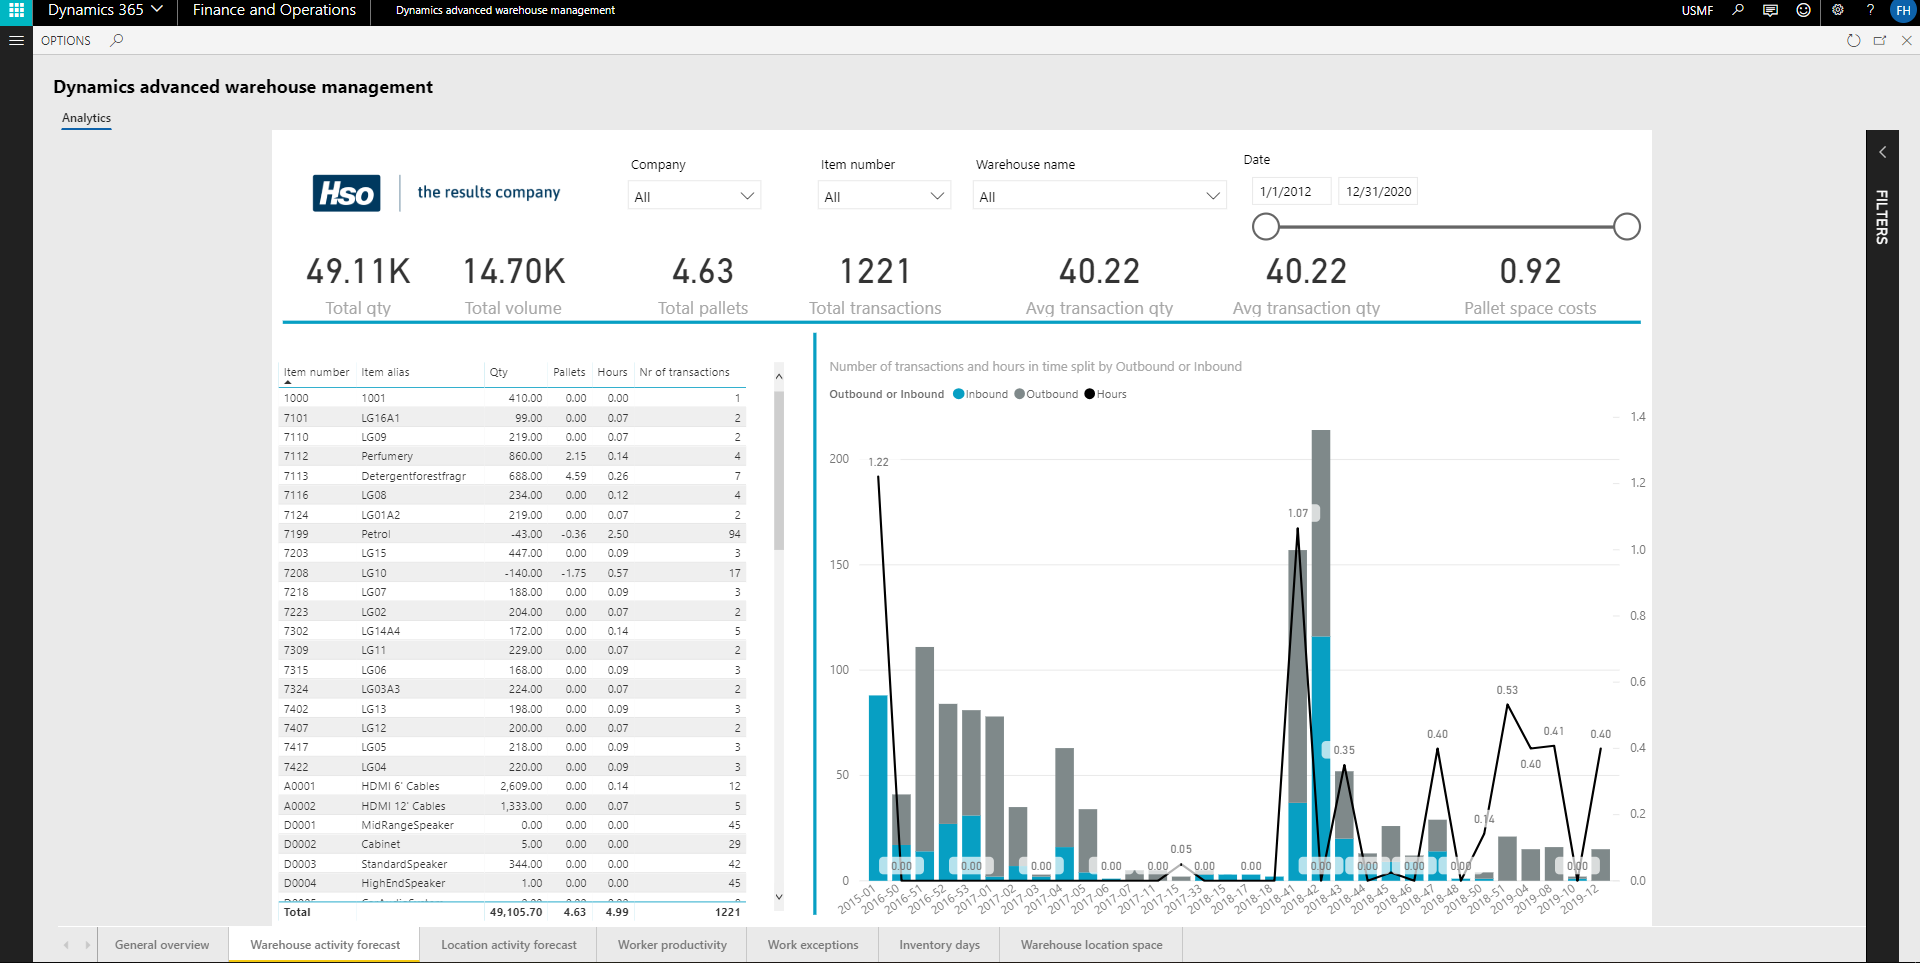
Advanced Warehouse Management adds an advanced analytical workspace Advanced Warehouse Management :
The main data sources for the work space are the work lines, work exceptions, ABC classification data and net requirements (MRP transactions).
In most cases, static MRP Master planning runs every night, or twice a day. For analysis and forecast purposes online data is often not required. Advice is to prepare the other data through batch jobs that run every night or in the weekend.
Master planning > Run > Master planning
Select the plan that was specified in the parameter for pallet space calculation.
Product information management > Released products > Fast tab Warehouse
For each released product, make sure that the quantity per pallet space is filled.
Warehouse management > Periodic > Warehouse ABC classification
Run the ABC classification.
System administration > Setup > Entity store
Prepare the data for several work spaces in socalled aggregate measurements.
Important
Select aggregate measurement "DYSDWAAnalytics" and press Refresh.
System administration > Inquiries > Batch jobs
The measurements are refreshed through a batch job. Depending on the amount of data, this takes several minutes or more. When the batch job is ended successfully, the work spaces can be explored.
Also, make sure that the Full reset batch job BIMeasurementProcessorFull is running.
This tab displays most important forecast information at a glance:
Open the filter on the right pane to drill down in the data.
This tab displays the number of transactions (separated inbound and outbound) and estimated man hours required per week.
This information can be used for planning and hiring warehouse workers for the coming weeks.
This tab displays the projected warehouse activity per aisle and rack in a schematic top view. Note that this is based on the newest fixed locations of the items for which future transactions and/or demand forecast exist.
Based on this information, the warehouse manager can predict congestion in parts of the warehouse, and decide to change the location of certain items. Red colored racks will be visited very often.
Appropriate actions could be:
When labor standards are used, this tab displays:
This tab displays the work exceptions that are logged through the mobile device. Purpose is to identify the problematic items, training demand, and vendor compliance issues.
Three main types of exceptions are the general work exceptions, short pick reasons and receiving exceptions. These exceptions are related to items and customers/vendors and workers.
This tab displays per released product, the number of days demand that can be covered by the current inventory.
Prerequisites and assumptions:
Example to detect problematic overstock:
on the right pane, filter on ABC frequency code A, and short lead time, sort on descending number of inventory days. Consider the reason behind this high stock level: if it is not strategic, the min max stock levels quantities for this item should be reviewed.
Note
This tab displays the items with the number of pallets, pallet space cost and aisle and rack of the fixed location. Purpose is to analyze the pallet space claimed by various items in the warehouse.
In the scatter chart, released products are plotted with the number of inventory days on the X-axis and cubic velocity on the Y-axis. The items that cause the biggest challenge in terms of warehouse pallet space are in the upper right quadrant.
Appropriate actions for these items might be: